If you have been doing functional testing for a while and someone just dropped “performance testing” into your sprint, k6 load testing is the fastest way to get from zero to something useful without needing a DevOps background. The core idea behind k6 is straightforward: it simulates multiple users hitting your system simultaneously so you can find out what breaks under real load before your actual users do. What “multiple users” means depends entirely on what you are testing. A payment endpoint under 50 concurrent transactions is already a serious load scenario. A CMS with 200 editors saving changes at the same time is a different problem entirely. k6 lets you define that scenario and run it. Most performance testing content assumes you already live in infrastructure and CI/CD pipelines. This post does not. It starts where you actually are: you know how to test, you know APIs, and you need to learn one more tool.
Why QA Engineers Keep Avoiding Performance Testing
The honest reason most QA engineers avoid performance testing is that the tooling has always felt like it belongs to someone else. JMeter has a GUI that looks like it was designed in 2004 and requires XML configuration that nobody wants to read. Gatling is JVM-based. LoadRunner costs money most teams do not have. If you never went deep on Java, and most QA engineers who came up through automation did not, the implicit message from all of it has been: this is for DevOps or performance engineers, not for you. That was my situation. Java beyond hello world was not in my stack, so performance testing stayed in the “someone else’s problem” category until k6 existed. k6 is JavaScript. That single fact changed the entry point completely.
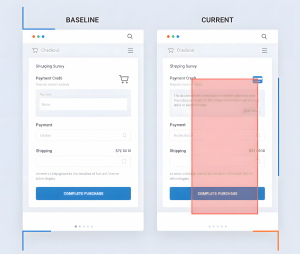
Here is the scenario that made performance testing click for me. I was testing a CMS where multiple editors could work simultaneously. One user edits a record and saves. That change should propagate to every other active user in real time, no page refresh required. With one user in functional testing, it works fine. You test it, it passes, you move on. The problem shows up when you put 50 or 100 editors in the same table at the same time. Suddenly the real-time sync starts dropping updates, some users are seeing stale data, and the only way to get current state is to force a refresh. Nobody should need to do that. If your CMS requires an F5 before every edit to be sure you are working on current data, that is a failure that functional testing will never catch because functional testing never put that many users in the system at once.
Before k6, I used Playwright to simulate concurrent user scenarios for smaller scale tests. If you have worked with the patterns in Playwright beyond testing, you already know Playwright can do more than run assertions in a browser. Spinning up multiple Playwright instances to simulate concurrent editors is a legitimate approach and it works. The limit is that Playwright carries full browser overhead for every virtual user. At 10 or 20 concurrent sessions it is manageable. At 100 it becomes expensive on your machine and slow to run. Playwright is the right tool for testing concurrent behavior with real browser context at smaller scale. When you need to understand what your system does under genuine load, you need a dedicated tool built for that purpose. That is k6.
What k6 Actually Is (and Why It Is Not Another DevOps Tool)
k6 is an open source load testing tool built by Grafana Labs. It uses JavaScript for test scripts, runs as a single binary with no dependencies, and outputs results to your terminal by default. There is a cloud version with dashboards and distributed load generation, but you do not need it to start. The free local version is fully functional for most QA use cases.
The key difference between k6 and older tools is that k6 is code-first. Your test is a JavaScript file. You import the k6 HTTP library, define your scenario, set your load parameters, and run it. This means your performance tests live in the same repository as your other tests, can be reviewed like any other code, and can be committed and versioned without exporting XML or proprietary formats.
k6 also integrates cleanly with the tools QA engineers already use. If you are running Playwright for end-to-end tests and using the patterns covered in Playwright automation for QA testing, the transition to k6 for performance scripts is a small step, not a full context switch. The scripting style is different but the underlying logic is the same: define what you want to test, define the conditions, assert the outcome.
One thing to set expectations on early: k6 is primarily an API and HTTP load testing tool. It can do browser-based load testing via the xk6-browser extension, but the core use case is hitting endpoints at scale. If your application has a backend API, k6 is the right tool. If you need to simulate full browser sessions at load, the picture is more complex.
Your First k6 Load Test in Under 10 Minutes
Install k6 first. On Windows you can use the installer from the k6 download page or install via Chocolatey with choco install k6. On Mac use brew install k6. On Linux, the k6 documentation has package manager instructions for every major distribution.
Once installed, create a file called load-test.js and paste in this script:
javascript
import http from 'k6/http';
import { check, sleep } from 'k6';

export const options = {
  vus: 10,
  duration: '30s',
};

export default function () {
  const res = http.get('https://test.k6.io');
  check(res, {
    'status is 200': (r) => r.status === 200,
    'response time under 500ms': (r) => r.timings.duration < 500,
  });
  sleep(1);
}
Run it with k6 run load-test.js. What this does: it spins up 10 virtual users, each making a GET request to the k6 test endpoint, sleeping for one second between requests, for 30 seconds total. The checks verify that every response returns a 200 status and completes in under 500 milliseconds.
That is a real load test. It is not a toy example. Swap the URL for your API endpoint, adjust the virtual user count and duration, and you have something you can actually use. The k6 test endpoint exists specifically for this purpose so you can run examples without needing your own server available.
The options block is where you control load shape. vus is virtual users. duration is how long to run. You can also define stages for ramp-up and ramp-down, which is how you simulate traffic patterns that look like real usage rather than a flat load. A staged scenario looks like this:
javascript
export const options = {
  stages: [
    { duration: '30s', target: 20 },
    { duration: '1m', target: 20 },
    { duration: '10s', target: 0 },
  ],
};
This ramps up to 20 virtual users over 30 seconds, holds for one minute, then ramps down. That pattern is more realistic than throwing 50 users at an endpoint all at once and is usually what you want for pre-release load testing.
Reading the Results Without Getting Lost
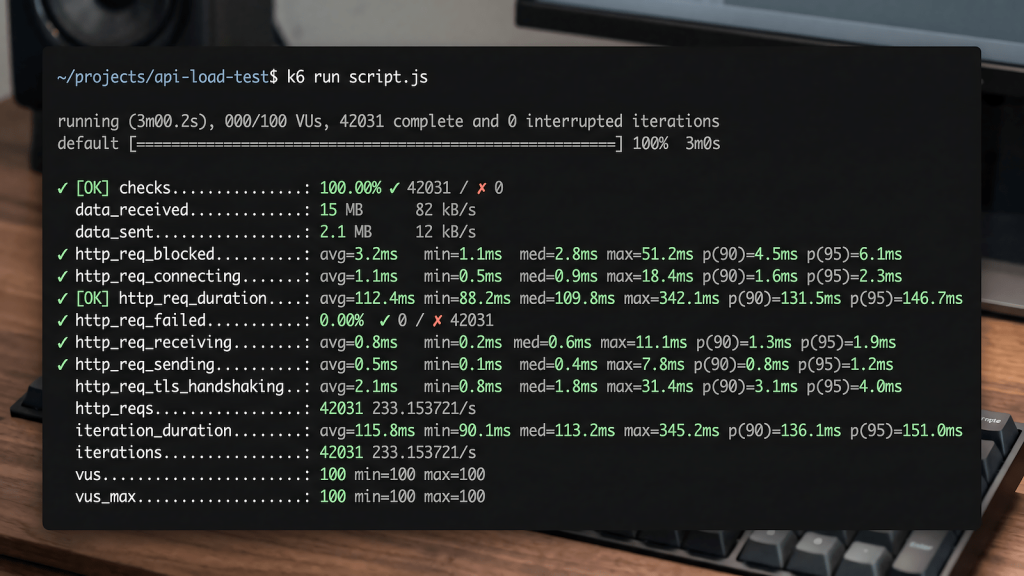
When k6 finishes, it prints a summary to your terminal. The output looks dense the first time but most of it is noise for basic QA use cases. Here is what to focus on:
http_req_duration is the most important metric. It shows the average, median, 90th percentile, and 95th percentile response times for all requests. The 95th percentile is the one that matters most. If your p95 is 800ms, that means 95 percent of your users are getting responses in under 800ms. The remaining 5 percent are slower. What counts as acceptable depends on your application’s SLA, but for most web APIs, p95 under 500ms is a reasonable starting target.
http_req_failed shows the percentage of requests that returned an error. Any non-zero value here needs investigation. A 1 percent failure rate under load that does not appear in functional testing usually means a concurrency issue, a connection pool limit, or a timeout that only shows up when multiple users hit the endpoint simultaneously.
checks shows how many of your defined assertions passed. If you wrote a check for “status is 200” and 98 percent of checks passed, you have 2 percent of requests returning something other than 200 under load. That is a finding worth documenting and escalating.
iterations and vus tell you how many complete test iterations ran and the maximum virtual user count reached. These confirm your test ran as configured. If you set 10 VUs for 30 seconds and the iteration count is far lower than expected, something slowed down your test execution itself, not just the target endpoint.
The regression testing guide on QAJourney covers how to track changes over time in functional testing. The same principle applies to performance: run k6 before and after a significant backend change and compare the p95 response times. A regression in performance is just as valid a finding as a regression in functionality.
Where k6 Fits in a Real QA Workflow
The most practical place to add k6 in a QA workflow is pre-release performance validation. Before a major release or after a significant backend change, run a load test against the endpoints that handle the most traffic or that are most critical to the user experience. This does not need to be a full performance engineering exercise. A 5-minute k6 run against your top 3 API endpoints with a realistic user count gives you a baseline and a before-and-after comparison point.
The second place k6 fits is in CI/CD pipelines. k6 can run as part of a GitHub Actions or GitLab CI workflow, fail the build if p95 exceeds a threshold, and post results to Grafana or Datadog if your team uses those tools. This is where the DevOps integration story comes in, but you do not need to own the pipeline configuration to write the k6 script that the pipeline runs.
If you are already doing API testing with Postman or working with the patterns in the manual API testing guide for QA, you can reuse the same endpoint knowledge for k6 scripts. The difference is that instead of verifying one request at a time, you are verifying the same request under concurrent load. The assertions are the same. The scale is different.
k6 also produces output that non-technical stakeholders can understand if you frame it correctly. “95 percent of users get a response in under 400 milliseconds” is a result anyone can evaluate against a business requirement. That framing, more than any dashboard, is what makes performance testing findings actionable in a sprint review.
For QA engineers who are working toward broader responsibilities, load testing is one of the skills covered in going beyond testing as a QA engineer because it positions you as someone who thinks about system behavior, not just feature correctness. It is also a natural extension of the API and backend testing work covered in API integration and backend testing.
k6 vs JMeter vs Gatling: The Honest Comparison for QA Teams
The performance testing tool landscape maps almost exactly to what happened with browser automation. JMeter is the Selenium of load testing: old guard, Java-based, GUI-driven, XML under the hood. It works and it has been working for two decades, but the workflow is slow and the test files are a nightmare to review in a pull request. Gatling sits in the middle, closer to the Cypress position: better developer experience than JMeter, but still JVM-based and running on Scala with a Java DSL option. It has a steeper learning curve than its marketing suggests.
k6 is the Playwright of load testing. It is JavaScript-native, code-first, runs as a single binary with no Java dependency, and the scripting model will feel immediately familiar if you have already written Playwright automation. You are not learning a new paradigm. You are applying the same skills you already have to a different class of test. If you made the move from Selenium to Playwright and remember how much faster everything felt once the friction was gone, that is exactly what switching from JMeter to k6 feels like.
For a QA engineer with Playwright experience, k6 is the natural next tool. You already know how to write JavaScript test logic, how to structure assertions, and how to think about what you are testing and why. The k6 HTTP library is simpler than the Playwright browser API. The mental model of virtual users making requests maps cleanly onto the mental model of test users taking actions. The transition is not a full context switch. It is an extension of work you already know how to do, applied to a question you have probably been asked but not had a clean answer for: what does this API actually do under load?
If your team already has JMeter tests maintained by someone who owns them, there is no urgent reason to rewrite everything. But if you are starting from zero and your stack is modern HTTP APIs, k6 is the faster path to useful results, and it is the tool that will feel least foreign to anyone who already lives in JavaScript test automation.