Performance testing on a locked-down Windows machine with no WSL, no admin rights, and no Chocolatey access is not a setup most k6 tutorials cover. This is what actually worked, what broke first, and what three staged test runs against a live AI-powered app revealed about endpoint latency when real AI generation is in the loop.
This post covers the full workflow: getting k6 running under constraints, using DevTools to locate auth tokens and endpoints before hitting a compression wall, escalating to the AI dev for the function list, and writing a k6 script that tests both AI action calls and direct backend queries. The numbers at the end are real.
Why This Setup Exists
Most k6 guides assume you are running Linux or macOS, or that you have admin access on Windows to install via Chocolatey or winget. When you are doing QA on a client engagement with a locked-down machine, neither of those is guaranteed. WSL was not available. System32 write access was blocked. Chocolatey install requires an elevated PowerShell session, which was not happening.
The workaround is simpler than it sounds. k6 ships as a standalone binary. You do not need an installer. You do not need a package manager. You download the Windows binary, drop it in a local folder your user account can write to, and call it from Git Bash using the full path. That is the entire workaround.
bash
# Drop the binary in your home directory
mkdir ~/k6

# Move or copy k6.exe there after extracting the zip
# Then run tests like this:
~/k6/k6.exe run your-test-script.js
The binary runs fine in Git Bash. No path changes needed if you use the full path every time. If you want it permanently accessible, add the folder to your user PATH variable in Windows environment settings, which does not require admin rights. But for a retainer engagement where you just need it working today, the full path call is enough.
One thing to confirm before your first run: k6 is a command-line tool. It has no GUI. It outputs results to the terminal and optionally to a JSON or CSV file. If you expected a dashboard, that is a separate setup using Grafana and InfluxDB. For baseline testing on a single engagement, the terminal output is sufficient.
Finding the Endpoints: DevTools First
Before you can write a k6 script, you need two things: the endpoint URLs and the auth token. Most QA engineers who primarily do functional testing have not done this before. Here is what the process looks like in practice.
What DevTools Can Tell You
Open the app in Chrome or Edge. Open DevTools with F12 or right-click and inspect. Go to the Network tab. Now use the application normally, signing in and triggering a few features. You are watching what requests fire.
Auth is easy. Click any authenticated request in the network tab and open the Headers panel. You are looking for the Authorization header in the Request Headers section. On most modern apps it reads Authorization: Bearer [token]. Copy that token. That is what goes into your k6 script. On the app tested for this engagement, the Bearer token was visible immediately on the first authenticated request after login.
Endpoint shape is readable, partially. For apps built on conventional REST APIs, the network tab gives you clean URLs, methods, and request bodies. You can reconstruct the full API call from what DevTools shows you. On the app used in this engagement, the backend is built on Convex, which uses a real-time function-based architecture instead of traditional REST endpoints. The request payload showed a path field with the function name, a format field set to convex_encoded_json, and the function arguments as an array. That is readable. You can see the function being called.
Where DevTools Hits a Wall
The response body is the problem. Convex uses gzip-js compression on responses, which is a JavaScript-side gzip implementation. The browser’s built-in decompression does not kick in for this. When you click the Response tab in DevTools, you see raw compressed bytes that are completely unreadable. You cannot inspect what the endpoint is actually returning.
This means DevTools gives you partial endpoint visibility on a Convex-backed app. You can see the function names being called from the request payload, which is useful. You cannot validate response structure or enumerate all available functions from the network tab alone.
The query string on these requests shows the compression flag explicitly:
?ip=0&_=1782141803832&ver=1.372.9&compression=gzip-jsIf you see compression=gzip-js in your network tab, you are in this situation.
What to Do When DevTools Is Not Enough
You have a few options depending on what access you have.
Ask the dev. If you are working with a development team, the fastest path is asking them for the function list directly. On an AI-built app with an AI dev team, this means asking the AI developer for the Convex queries, mutations, and actions for the features you are testing. You get accurate function names, argument shapes, and expected response structures in one step. This is what was used for this engagement.
Postman with interceptor. If you have Postman access, the Postman interceptor can capture and decode traffic from the browser including compressed responses. This requires installing the Postman desktop agent and the interceptor extension. Worth setting up if you are doing repeated API testing on the same project.
Fiddler Classic or Fiddler Everywhere. Fiddler decodes gzip automatically and shows you fully readable response bodies. The free Fiddler Classic version handles this on Windows without admin rights. Point the browser proxy settings at Fiddler and all traffic flows through it.
mitmproxy. A Python-based proxy that can decompress and display responses. Requires Python on your machine. More setup than Fiddler but scriptable if you want to automate the interception.
For this engagement, asking the AI dev was the right call. It was faster, it was accurate, and it avoided the proxy setup overhead on a machine with restrictions already in play. The practical takeaway is that DevTools is always your first move because it requires nothing and gives you auth and partial endpoint visibility. Know where it stops and know your escalation path.
Writing the k6 Script for a Convex Backend
With the Bearer token from DevTools and the function list from the AI dev, the script structure is straightforward. Convex exposes three HTTP endpoints for external calls: /api/action for functions that call external services (including AI), /api/query for read operations, and /api/mutation for write operations.
Here is the helper function pattern used across all test runs:
javascript
import http from "k6/http";
import { check, sleep } from "k6";
import { Trend, Rate } from "k6/metrics";

const CONVEX_URL = "https://your-project.convex.cloud";
const TOKEN = "YOUR_BEARER_TOKEN_HERE";

const headers = {
  Authorization: `Bearer ${TOKEN}`,
  "Content-Type": "application/json",
};

// AI calls and external service calls go through /api/action
function convexAction(path, args) {
  return http.post(
    `${CONVEX_URL}/api/action`,
    JSON.stringify({ path, format: "json", args: [args] }),
    { headers }
  );
}

// Read-only queries go through /api/query
function convexQuery(path, args) {
  return http.post(
    `${CONVEX_URL}/api/query`,
    JSON.stringify({ path, format: "json", args: [args] }),
    { headers }
  );
}

// Write operations go through /api/mutation
function convexMutation(path, args) {
  return http.post(
    `${CONVEX_URL}/api/mutation`,
    JSON.stringify({ path, format: "json", args: [args] }),
    { headers }
  );
}
The format: "json" in the request body is important. When calling the HTTP API directly from k6, you use JSON format rather than the convex_encoded_json format you see in DevTools, which is the browser client’s native format. The HTTP API accepts plain JSON.
Custom Metrics Per Endpoint
Rather than relying on k6’s default http_req_duration metric across all requests, define a separate Trend metric for each endpoint. This gives you per-endpoint p95 values in the summary output instead of a single aggregated number that hides the difference between a 300ms database query and a 26-second AI generation call.
javascript
const heavyAiDuration = new Trend("heavy_ai_duration");
const mediumAiDuration = new Trend("medium_ai_duration");
const directQueryDuration = new Trend("direct_query_duration");
const aiErrorRate = new Rate("ai_error_rate");
Then after each request, add the duration to the appropriate metric:
javascript
const res = convexAction("tools/run:yourTool", { input: "test" });
heavyAiDuration.add(res.timings.duration);
aiErrorRate.add(res.status === 0 || res.status >= 500);
Thresholds for AI Endpoints
Standard k6 thresholds assume sub-second or low-second response times. When you are testing AI generation endpoints, you need to set thresholds that reflect the actual expected latency for the workload. A complex multi-part AI generation call that produces structured output across multiple categories will legitimately take 20 to 30 seconds. A threshold of p(95)<30000 is not a concession, it is an accurate representation of what acceptable looks like for that endpoint.
Direct database queries with no AI involvement should still be fast. The threshold contrast between AI and non-AI endpoints is itself a useful data point. It tells you clearly which latency is architectural and which latency is a problem.
javascript
export const options = {
  vus: 1,
  duration: "5m",
  thresholds: {
    heavy_ai_duration: ["p(95)<30000"],
    medium_ai_duration: ["p(95)<10000"],
    direct_query_duration: ["p(95)<3000"],
    ai_error_rate: ["rate<0.05"],
  },
};
Sleep Between AI Calls
Add sleep between AI action calls. The sleep(5) after each AI call in the test loop is not padding — it prevents the script from hammering the backend with back-to-back AI generations on a baseline single-VU run. AI calls burn API credits or compute time on the backend. Sequential calls without sleep create a synthetic concurrent load that does not represent real user behavior on a baseline test.
javascript
export default function () {
  const res = convexAction("tools/run:yourHeavyTool", {
    input: "test input for performance baseline",
  });
  check(res, {
    "not 401": (r) => r.status !== 401,
    "not 500": (r) => r.status !== 500,
    "responded": (r) => r.status !== 0,
  });
  heavyAiDuration.add(res.timings.duration);
  sleep(5);
}
For the k6 fundamentals and script structure basics, the existing tutorial on QAJourney covers the ground on options, VU configuration, and reading output. This post builds on that foundation and focuses specifically on the constraints and the AI endpoint behavior.
The Three Test Runs
All three runs were executed against the same Convex backend with a single virtual user. This is a baseline run, not a load test. The goal is establishing per-endpoint response time benchmarks before any concurrent testing is attempted.
Run 1: Baseline (1 VU, 1 minute)
Target: The server and the frontend served from the same staging environment.
This run confirmed the infrastructure was healthy before touching any AI endpoints. Both the server response and the frontend page load came in under 600ms p95. No errors. Clean baseline.
Run 2: AI Tools Targeted (1 VU, 2 minutes)
Two endpoints in isolation: one heavy AI generation call and one direct query.
| Endpoint Type | p95 | Notes |
|---|---|---|
| Heavy AI generation | ~27,000ms | Complex multi-part structured output |
| Direct query | ~800ms | No AI, standard database read |
The heavy AI generation call produces complex structured output across multiple categories with cross-referencing logic. The 27-second p95 is expected given that workload. The direct query at 800ms confirms the backend is responsive when AI is not in the path.
Run 3: Full Suite (1 VU, 5 minutes)
All live endpoints covering every AI tool and direct query in the application.
| Endpoint | p95 | Category |
|---|---|---|
| Heavy AI generation | 25,954ms | AI action, complex output |
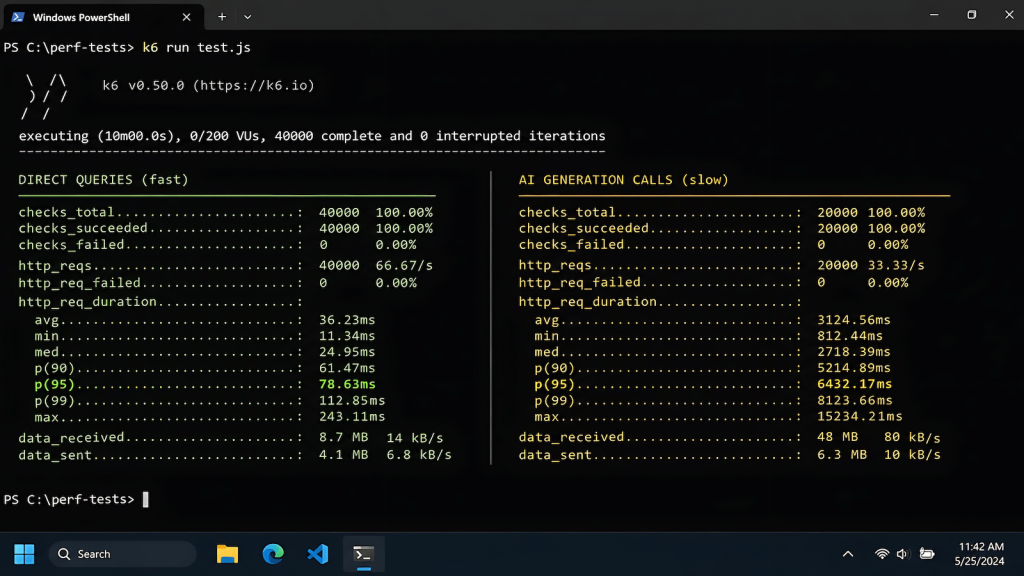
| Direct query (fast) | 288ms | No AI, schedule data |
| Medium AI call 1 | 3,015ms | AI action, email generation |
| Medium AI call 2 | 3,073ms | AI action, natural language parsing |
| Direct query (bills) | 767ms | No AI, list read |
| Agent acknowledgment | 377ms | Partial — see note below |
105 checks. 0 failures. 0% error rate.
On the 377ms agent acknowledgment: This number looks fast and is technically accurate, but it is not the full picture. The agent endpoint tested here is a chat.send call that returns an acknowledgment that the message was received. The actual AI response streams back separately through a different mechanism. The 377ms is the send latency, not the response latency. If you are evaluating agent response time for UX purposes, this number is not the one to cite. Flag this to the dev team and plan a separate measurement approach for streaming responses.
What the Numbers Mean
The latency tiering across these results reflects architecture, not performance problems. Direct Convex queries with no AI in the path run at 288ms to 767ms. That is the backend doing what a backend should do. Medium AI calls at around 3 seconds reflect a single-pass generation with moderate output scope. The heavy AI generation at 26 seconds reflects a complex multi-part output task where the generation itself is the bottleneck and that bottleneck is inherent to the workload.
The only actionable finding from these runs is a UX concern on the heavy AI generation endpoint. 26 seconds is a long time to wait with no feedback. An application that produces correct output after 26 seconds but shows nothing to the user during that window has a UX problem that is independent of whether the backend performance is acceptable. Loading states, progress indicators, or streaming partial output are the standard solutions. The performance baseline does not need to change. The user experience of waiting for it does.
This is covered in more detail in the post on testing AI-generated code and what changes when the dev team is an AI agent, the backend can pass every threshold and still produce a broken user experience if the frontend does not handle async AI latency correctly.
What the Script Cannot Tell You
Mobile Is a Separate Workstream
k6 running against a mobile build served from a different port is still measuring server-side response times, not mobile device performance. If the app has a mobile version, the Convex backend response times will be identical regardless of which port you test against because the backend is the same. True mobile performance testing requires on-device testing or a tool like BrowserStack. The numbers in this post are server-side and desktop-confirmed only.
Concurrent Load Is Pending
All three runs used a single virtual user. This is baseline performance under no concurrent load. The real question for a pre-launch application is how the backend behaves at 10 to 50 concurrent users each firing AI action calls simultaneously. That test is pending client approval for two reasons: AI action calls burn backend credits or compute budget on every iteration, and a sudden spike of 50 concurrent requests hitting the AI endpoints could look like an attack to monitoring systems if the ops team is not warned first.
Before running concurrent load tests on an application with AI endpoints, coordinate with the development team and ops. Confirm the credit budget for the test run. Confirm timing so backend anomaly detection does not fire. The Playwright performance optimization post has useful framing on planning test runs in CI contexts, which applies here for the coordination layer even though k6 is the execution tool.
The Actual Workflow for QA on an AI Dev Team
The pattern across this engagement reflects something worth naming directly. Performance testing on an AI-powered app built by an AI dev team is not the same as performance testing a conventional web application. The endpoints behave differently, the latency profile is different, and the recon process is different because the backend is not a conventional REST API.
DevTools gets you in the door. Auth tokens are in the request headers and are easy to find. Endpoint names are partially visible in request payloads. Response bodies are compressed and unreadable without additional tooling. The AI dev is the fastest source for accurate function signatures when you need the complete picture.
The k6 binary workaround gets you running without admin rights or WSL. The script structure maps cleanly to Convex’s three endpoint types. Custom metrics per endpoint give you the per-tool visibility you need when the latency range spans three orders of magnitude.
Zero failures across 105 checks on a baseline single-user run is a green light for the concurrent stage, not a sign that performance testing is done. The baseline tells you what the system looks like under no pressure. The concurrent test tells you whether it holds. That test is next.